details-of-details

実験室用冷凍庫市場 ― 製品別 (凍結保存、プラズマ冷凍庫、防爆冷凍庫、酵素冷凍庫、超低温冷凍庫、血液銀行冷蔵庫、薬局冷蔵庫、クロマトグラフィー冷蔵庫)、エンドユーザー別、および地域別-世界の予測2033年

調査の場所: 北米(米国およびカナダ)、ラテンアメリカ(ブラジル、メキシコ、アルゼンチン、その他のラテンアメリカ)、ヨーロッパ(英国、ドイツ、フランス、イタリア、スペイン、ハンガリー、ベルギー、オランダおよびルクセンブルグ、NORDIC(フィンランド、スウェーデン、ノルウェー) 、デンマーク)、アイルランド、スイス、オーストリア、ポーランド、トルコ、ロシア、その他のヨーロッパ)、ポーランド、トルコ、ロシア、その他のヨーロッパ)、アジア太平洋(中国、インド、日本、韓国、シンガポール、インドネシア、マレーシア) 、オーストラリア、ニュージーランド、その他のアジア太平洋地域)、中東およびアフリカ(イスラエル、GCC(サウジアラビア、UAE、バーレーン、クウェート、カタール、オマーン)、北アフリカ、南アフリカ、その他の中東およびアフリカ)

お客様の要件 についてお知らせください。

市場スナップショット

実験室用冷凍庫市場は、2023年に49.3億米ドルの市場価値から、2033年までに79.5億米ドルに達すると推定され、2023-2033年の予測期間中に4.9%のCAGRで成長すると予想されています

Slide1
このレポートの詳細については、以下をご覧ください : サンプルレポート請求

市場概況

実験室用冷凍庫市場は、2023年に49.3億米ドルの市場価値から、2033年までに79.5億米ドルに達すると推定され、2023-2033年の予測期間中に4.9%のCAGRで成長すると予想されています。


クリックするとサンプルレポートのPDFをダウンロードできます

レポート範囲

CAGR

4.9%

予測年

2023-2033年

基準年

2023年

予測年の市場価値

79.5億米ドル

実験室用冷凍庫市場セグメント

実験室用冷凍庫市場は、製品別 (凍結保存、プラズマ冷凍庫、防爆冷凍庫、酵素冷凍庫、超低温冷凍庫、血液銀行冷蔵庫、薬局冷蔵庫、クロマトグラフィー冷蔵庫)、エンドユーザー別 (病院)、および地域別に分割されます。これらのセグメントは、さまざまな要因に基づいてさらにサブセグメント化され、各セグメントおよびサブセグメントの複合年間成長率、評価期間の市場価値およびボリュームなど、市場に関するいくつかの追加情報で構成されます。

製品に基づいて、冷凍庫セグメントは、予測期間の実験用冷凍庫市場で最高の市場シェアを保持しています。

製品に基づいて、実験用冷凍庫市場は冷凍庫、冷蔵庫、および凍結保存システムに分割されます。 2020 年には、冷凍庫セグメントが市場の 52.4% という最大のシェアを占めました。 このセグメントの大部分は、ワクチン開発をサポートするための製薬会社やバイオテクノロジー企業、学術研究機関、および検査サンプルを保管するための医療研究所や病院での有用性に起因する可能性があります。

製品に基づいて、超低温冷凍庫セグメントは、予測期間中に冷凍庫市場で最高の CAGR で成長します。

冷凍庫市場は、酵素冷凍庫、プラズマ冷凍庫、防爆冷凍庫、可燃性物質冷凍庫、実験用冷凍庫、超低温冷凍庫に分類されます。 超低温冷凍庫セグメントは、予測期間中に最高の CAGR で成長すると予測されています。 このセグメントの成長は、研究目的で使用される敏感な幹細胞、ウイルスサンプル、骨移植片、およびその他の生物学的サンプルを保存するためのこれらの冷凍庫の有用性によって大きく推進されています。

研究用冷蔵庫セグメントは、予測期間中、冷蔵庫市場で最高の市場シェアを持っています。

このレポートでは、冷蔵庫市場は、血液銀行冷蔵庫、クロマトグラフィー冷蔵庫、防爆冷蔵庫、可燃性物質冷蔵庫、実験室冷蔵庫、薬局冷蔵庫にさらに分割されています。 大規模なシェアの実験室用冷蔵庫セグメントは、医療研究所、病院、および診療所での試験サンプルの短期保管におけるこれらの製品の有用性によるものです。 これらの冷蔵庫は、日常的な実験室の保管要件を満たし、実験室の操作を簡素化します。

実験室用冷凍庫市場の地域概要

実験室用冷凍庫市場は地域に基づいてさらに細分化されており、各国の市場成長が評価されます。これらには、北米(米国、カナダ、およびその他の北米)、ヨーロッパ(ドイツ、フランス、イタリア、スペイン、英国、およびその他のヨーロッパ)、アジア太平洋(中国、日本、インド、オーストラリア、シンガポール、およびその他のアジア太平洋)およびその他の地域が含まれます。

地域に基づいて、北米は予測期間の実験用冷凍庫市場で最大のシェアを保持しています。

 北米地域の大きなシェアは、主に米国とカナダでの医療費の高さと、この地域での医薬品とバイオテクノロジーへの研究開発費の増加によるものです。 この地域に多数の実験室用冷凍庫および冷蔵庫メーカーが存在することも、さまざまなエンドユーザーセグメントによる高度な実験室用冷凍庫の採用により、市場の成長を後押しする上で極めて重要な役割を果たしています。

実験室用冷凍庫市場の主要なキープレーヤー

実験室用冷凍庫市場の主要なキープレーヤーには、Eppendorf AG (ドイツ)、Haier Biomedical (中国)、Thermo Fisher Scientific, Inc. (米国)、Helmer Scientific (米国)、PHC Holdings Corporation (日本)、Liebherr (スイス)、Middleby Corporation (Follett Products, LLC)、Felix Storch, Inc. (米国)、BioLife Solutions, Inc. (スターリング ウルトラコールド) (米国)、Blue Star Limited (インド)、B Medical Systems (ルクセンブルグ)、Philipp Kirsch GmbH (ドイツ)、Avantor, Inc. (米国)、 Standex International Corporation (米国)、Vestfrost Solutions A/S (デンマーク)、Changhong Meiling Co. Ltd. (中国)、EVERmed S.R.L. (イタリア)、ARCTIKO A/S (デンマーク)、Glen Dimplex Medical Appliances (LEC Medical) (アイルランド)、So-Low Environmental Equipment Co. Ltd. (米国)、KW Apparecchi Scientifici SRL (イタリア)、Jeio Tech (共和国) 韓国)、Refrigerated Solutions Group (米国)、Stericox India Private Limited (インド)、Thalheimer Kühlung (ドイツ)、Antylia Scientific (米国)などがあります。この調査には、実験室用冷凍庫市場におけるこれらの主要企業の詳細な競合分析、企業プロファイル、最近の動向、および主要な市場戦略が含まれています。

Slide2
このレポートの詳細については、以下をご覧ください : サンプルレポート請求

  • 北米地域では、米国が 2033 年までにライオン シェアを維持し、優勢を維持します。前年比の成長率は、カナダと比較して米国でより良い需要を示すと予測されています
  • 2021 年、米国の医療費は 2.7% 増加し、4.3 兆米ドルに達しました。医療費は国の GDP の 18.3% に達しました。SDKI は、医療費 (%) が 2033 年までに GDP シェアの約 19% に達すると推定しています
    ドイツはこの地域で有利な市場であり続けます。2033 年までに需要を押し上げるために、国のヘルスケア システムにおけるヘルスケア イニシアチブとコネクテッド テクノロジーへの投資があります
    ドイツに続いて、現在、フランスは 2 番目に最大の市場です。ドイツは GDP の 12.6% をヘルスケアに費やしましたが、これは、フランスの場合 12.4% でした
Slide3
このレポートの詳細については、以下をご覧ください : サンプルレポート請求

アジア太平洋地域は、2033 年までに最も有望な地域です。中国が最大の市場シェアを保持し、インドがそれに続きます。
日本は常に有利な市場であり、2033 年までに需要の主要国の一つになると予測されています。日本の医療費は、国の GDP の 10.74% を占めています。SDKI は、ヘルスケアへの GDP シェア支出が 2033 年までに 14% に達すると予測しています。
市場のニーズを推進するために政府による支出が増加しています。しかし、反中国感情は、国内の中国市場プレーヤーに打撃を与える可能性があります。ヨーロッパ、アメリカ、国内の企業が日本での市場シェアを拡大するために押し上げます

目次

1 Introduction 35
1.1 Objectives of the Study 35
1.2 Market Definition 35
1.2.1 Inclusion and Exclusion 35
1.3 Market Size 36
1.3.1 Target Market 36Figure
1 Experimental Freezer Market Segmentation 36Figure
2 Experimental Freezer Market by Region 36
1.3. 2 Years considered for the study 37
1.4 Currencies 37
Table 1 Standard Currency Exchange Rate (USDD 37
) 1.5 Stakeholders 38
1.6 Summary of Changes 38
2 Research Methodology 40
2.1 Research Approach 40
2.2 Research Methodology Design < /> 2.2. 1 Secondary research < /> 2.2.1.1 Key data from secondary sources 42
2.2.2 Primary data 42
Figures 2 Primary sources 42
2.2.2.1 Key data from primary sources 43
2.2.2.2 Insights from primary experts 44
Figure 3 Breakdown of Primary Interviews: Supply-side
and Demand-side Participants 44
Figure 4 Breakdown of Primary Interviews: By Company,
Designation, and Region 45
2.3 Market Size Estimation: Laboratory Freezer Market 45
Figure 5 Supply-side Market Size Estimation: Revenue share analysis 46Figure
6 Revenue share analysis chart 46
Figure 7 Revenue Analysis of Top 3 Listed Companies: Laboratory Freezer Market (2020) 47
Figure 8 Bottom-Up Approach: US End-User Analysis –
Adoption of Blood Bank Refrigerators by Blood Banks 48
Figure 9 Bottom-Up Approach: US End User Analysis - Adoption Patterns of Plasma Freezers 49Figure 10
CAGR Forecast from Analysis of Drivers, Constraints, Opportunities and Challenges in Laboratory Freezer Market (2022-2026) 51Figure
11 CAGR Forecast: Supply Side Analysis
51Figure 12 COVID-19 Impact on Growth Rates (2019 vs. 2020 vs. 2021) 52
Figure 13 Top Down Approach 52
2.4 Market Breakdown and Data Triangulation 53
Figure 14 Data Triangulation Methodology 54
2.5 Market Share Estimation 55
2.6 Research Assumptions 55
2.7 Limitations 56
2.7.1 Methodology-Related Limitations 56
2.7.2 Scope-Related Limitations 56
2.8 Risk Assessment 56Table
2 Risk Assessment: Laboratory Freezer Market 56
3 Executive Summary 57Figure
15 Laboratory Freezer Market
2022 VS by Product 2026 (USD million) 57
Figure 16 Freezer market by type 2022 VS. 2026 (USD million) 58
Figure 17 Refrigerator market by type 2022 VS. 2026 (USD million) 58
Figure 18 Laboratory Freezer Market
2022 VS. 2026 by End User (USD Million) 59
Figure 19 Geographic Snapshot: Laboratory Freezer Market 60
4 Premium Insight 61
4.1 Laboratory Freezer Market Overview < > Figure 20 Laboratory Laboratory freezer market growth primarily
driven by technological advancements in laboratory freezers 61
4.2 North America: Laboratory freezer market by product 62
Figure 21 Freezers account for the largest share of the North American laboratory freezer market, by product in 2020 62
4.3 Laboratory Freezer Market: Regional Mix 63
Figure 22 China to Witness Highest Growth in Laboratory Freezer Market During Forecast Period 63
4.4 Regional Mix: Laboratory Freezer Market 64
Figure 23 North America Dominated Market in 2020 64
5 Market Overview 65
5.1 Introduction 65
5.2 Market Dynamics <> Figure 24 Experimental Freezer Market: Drivers, Constraints, Opportunities and Challenges 65
5.2.1 Market Drivers <> 5.2.1.1 Deployment of COVID-19 Vaccines Requiring Freezer Storage 66 5.2.1.2
Growing demand for blood and blood components for support in transfusion and cancer treatment /< > Figure 25 Europe: Source plasma collection 2011–2020 (liters)
) 67
5.2.1.3 Increasing organ transplant procedures < /> Figure 27 United States: Organ transplants from deceased and living donors
2010–2020 68
Figure 28 European Union: Number of organs transplanted 2010–2018 68
5.2.1.4 Laboratory freezers and Technological Advances in Refrigerators >< 5.2.2 Market Regulations < /> 5.2.2.1 Increased Use of Refurbished Laboratory Freezers < /> 5.2.3 Market Opportunities <> 5.2.3.1 Vaccine Development Against Emerging Infectious Diseases < /> 5.2 .3.2 Increasing Growth Opportunities in Developing Countries> < 5.2.4 Market Challenges <> 5.2.4.1 Lack of Recognition of the Availability of Specialized Laboratory Freezers and Refrigerators 70
5.3 Scenarios: Pessimistic, Realistic, Optimistic 71
5.3.1 Laboratory Freezer Market < /> 5.4 COVID-19 Impact Analysis 71
5.4.1 COVID-19 Health Exam 71
5.5 COVID-19 Economic Assessment 72
5.6 Assessment of Impact of COVID-19 on Economic Scenarios
Figure 72 29 Criteria Affecting the Global Economy 72
5.7 Assessing the Impact of COVID-19 on Economic Scenarios in the Laboratory Freezer Market 73
5.8 Trends/Disruptions Affecting Customers' Businesses (YC-YCC) 74
5.8.1 Experimental Freezer market < /> 5.8.1.1 Revenue sources are shifting to greener and more sustainable solutions < /> Figure 30 Revenue shift in the laboratory freezer market 75
5.9 Average Selling Price Trend 75
Table 3 Lab Freezer/Refrigerator Prices (USD) 76
Table 4 Average Lab Freezer Prices by Region (USD) 77
5.10 Ecosystem/Market Map 77
Table 5 Laboratory Freezer Market: Ecosystem 77
5.11 Value Chain Analysis < > Figure 31 Value Chain Analysis: Laboratory Freezer Market 78
5.12 Patent Analysis: Ultra Low Temperature Freezers 79
Figure 32 Key Patents for Ultra Low Temperature Freezers 79
5.13 Case Study Analysis 79
5.13.1 Case Study: Ultra Low Temperature Freezer Performance and Impact of Racking Use 79
5.14 Technical Analysis: Ultra Low Temperature Freezers 80
5.14.1 Main Technology < /> 5.14.1.1 Ultra Low Temperature Freezer Technology 80
5.14.2 Neighboring Technologies < /> 5.14.2.1 Cryopreservation 80
5.15 Regulatory Status <> 5.15.1 US 81
5.15.2 European Union 81
5.16 Trade Analysis: Major Markets for Import and Export (Ultra-Low Temperature Freezers) 82
5.16.1 Export Scenarios for Ultra-Low Temperature Freezers < > Figure 33 Export Scenarios for Ultra-Low Temperature Freezers
2019-2020 VS.
< > Figure 34 Imports of ultra-low temperature freezers by country
2019-2020 VS.2020–2021 83
5.17 Porter's Five Forces Analysis 83
Figure 35 Porter's Five Forces Analysis (2020): Laboratory Freezer Market 83
Table 6 Laboratory Freezer Market: Porter's Five Forces Analysis 84
5.17.1 Threats from New Entrants 84
5.17.1.1 Numerous Local Players in the Market 84
5.17 .1.2 High capital expenditure < > 5.17.2 Threat from substitutes 84
5.17.2.1 Use of commercial refrigerators/freezers < > 5.17.2.2 Dry ice as an alternative to ultra-low temperature freezers 84
5.17.3 Bargaining power of suppliers 85
5.17.3.1 Large number of suppliers and low switching costs 85
5.17.4 Bargaining power of buyers < /> 5.17.4.1 Buyers focus on quality, sustainability and maintenance support 85
5.17.5 Intense competition 85
プライマリ-->

inherit;">5.17.5.1 Similar Products Offered by Market Players < /> 6 Lab Freezer Market, By Product 86
6.1 Introduction 87
Table 7 Lab Freezer Market By Product 2019–2021 (USD Million) 87
Table 8 Lab Freezer Market By Product 2022–2026 (USD million) 87
Table 9 Laboratory Freezer Market By Country 2019–2021 (USD Million) 88
Table 10 Laboratory Freezer Market By Country 2022–2026 (USD Million) 88
6.2 Freezers 89
Table 11 Freezer Market by Type 2019–2021 (USD million) 89
Table 12 Freezer Market By Type 2022–2026 (USD Million) 89
6.2.1 Ultra Low Temperature Freezers 90
6.2.1.1 Growing Demand for Ultra Low Temperature Freezers for COVID-19 Vaccine Storage Drives Market Growth 90Table
13 Ultra Low Temperature Freezers Market Country
By 2019–2021 (USD Million) 91 Table 14 Ultra-Low Temperature Freezer Market 2022-2026 by
Country
(USD Million) 92
6.2.2 Laboratory Freezers 92
6.2.2.1 Number of Diagnostic Tests to Support Laboratory Freezer Market Growth Growth
92Table 15 Laboratory Freezer Market By Country 2019–2021 (USD Million) 93Table
16 Laboratory Freezer Market By Region 2022-2026 (USD Million) 93
6.2.3 Plasma Freezers 94
6.2.3.1 Growth of this Market 94Table
17 Plasma Refrigerator Market By Country 2019–2021 (Million USD) 94Table
18 Plasma Refrigerator Market By Country 202
9 Competitive Landscape 206
9.1 Introduction 206
9.2 Key Players 9.2.1
Overview of Strategies Adopted by Players in the Laboratory Freezer Market < /> 9.3 Revenue Share Analysis < > 9.3.1 Revenue Analysis of Key Players in the Laboratory Freezer Market < > Figure 39 Historical Five-Year Laboratory Freezer Market Key Players Revenue Analysis 209
9.4 Market share analysis < > 9.4.1 Laboratory freezer market (2020) < > Figure 40 Global laboratory freezer market share of key players (2020) 210
Table 247 Laboratory freezer market: degree of competition 211
9.5 Company evaluation Work Section 212
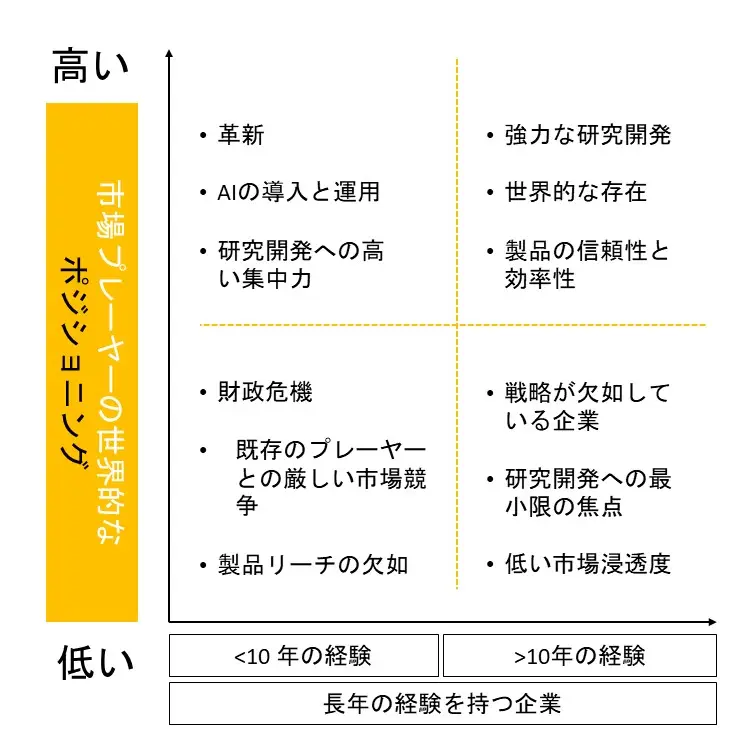
9.5.1 Company Rating Quadrant: Laboratory Freezer Market < /> Figure 41 Global Lab Freezer Market: Company Rating Matrix 2020 212
9.5.1.1 Stars 212
9.5.1.2 Prevailing Players 213
9.5.1.3 Emerging Leaders <> 9.5.1.4 Participants 213

9.6 Competitive Leadership Mapping for Startups (2020) 213
9.6.1 Progressive Companies <> 9.6.2 Dynamic Companies <> 9.6.3 Starting Blocks 214
9.6.4 Responses Company <> Figure 42 Laboratory Freezer Market: SME/Startup Rating Matrix 2020 214
9.7 Competitive Benchmark 215
9.7.1 Company Product/Service Footprint (20 companies) 215
Table 248 Product Footprint by Company (20 companies) 216
Table 249 Company End User Footprint (20 Companies) 217
​​Table 250 Business Area Footprint (20 Companies) 218
​​9.8 Competitive Situation and Trends 219
9.8.1 Product Launches and Approvals 219
Table 251 Product Launches and Approvals (2018– June 2021) 219
9.8.2 220
Deals Table 252 Deals (June 2018–2021) 220
9.8.3 Other Developments < /> Table 253 Other Developments (June 2018–2021) 221
10 Company Profile 222
10.1 Keys Players 222
(business overview, product offerings, recent developments, MnM view (strengths/wins,
strategic choices made, and weaknesses and competitive threats)*
10.1.1 Thermo Fisher Scientific Co., Ltd. 222
Table 254 Thermo Fisher Scientific: Business Overview 222Figure
43 Company Snapshot: Thermo Fisher Scientific (2020) 223
10.1.2 Haier Biomedical
227Table 255 Haier Biomedical: Business Overview 227
10.1.3 PHC Holdings Corporation 231
Table 256 PHC Holdings Corporation: Business Overview 231
10.1.4 Eppendorf AG 234Table
257 Eppendorf AG: Business Overview
234Figure 44 Company Snapshot: EPPENDORF AG (2020) 235
10.1.5 Avantar Corporation
238Table 258 Avantar: Business Overview 238Fig
. 45 Company Profile: Avantar Ltd. (2020) 239
10.1.6 Helmer Scientific 241
Table 259 Helmer Scientific: Business Overview 241
10.1.7 Middleby Corporation (Follett Products, LLC)
245Table 260 Middleby K.K.: Business Overview 245Figure
46 Company Snapshot: Middleby K.K. (2020) 246
10.1. 8 LIEBHERR 249
Table 261 Lieber: Business Overview 249
Figure 47 Company Snapshot: Liebherr (2020) 250
10.1.9 Felix Storch 252
Table 262 Felix Storch: Business Overview 252
10.1.10 BioLife Solutions Inc. ( Sterling Ultra Cold) 254
Table 263 BioLife Solutions: Business Overview 254Figure
48 Company Snapshot: BioLife Solutions (2020) 255
10.1.11 Blue Star Limited 257
Table 264 Blue Star Limited: Business Overview
Figure 257 49 Company Snapshot: Blue Star Limited (2020) 258
10.1.12 Philipp Kirsch GMBH 260
Table 265 Philippe Kirsch GMBH: Business Overview 260
10.1.13 B Medical Systems 262
Table 266 B Medical Systems: Business Overview 262
10.1.14 Standex International Corporation 264Table 267 Standex
International Corporation: Business Overview 264Fig
50 Company Snapshot: Standex International Corporation (2020) 265
10.1.15 EVERMED SRL 267Table
268 EVERMED SRL: Business Overview 267
10.1.16 Arctiko A/S 268
Table 269 Arctiko A/S: Business Overview 268
Figure 51 Company Snapshot: ARCTIKA / S (2019) 268
10.1.17 Best Frost Solution A/S 270
Table 270 Best Frost Solution A /S: Business Overview 270
10.1.18 Glendiplex Medical Devices (LEC Medical) 271
Table 271 Glendiplex Medical Devices: Business Overview 271
10.2 Other Emerging Players 273
10.2.1 Low Environment Equipment Ltd. 273
Table 272 SO-LOW Environmental Co., Ltd.: Business Overview 273
10.2.2 Changhong Meilin Co., Ltd. 275
Table 273 Changhong Minglin Co., Ltd.: Business Overview
275Figure 52 Company Snapshot: Changhong Minglin Co., Ltd. (2020) 276
10.2.3 KW APPARECCHI SCIENTIFICI SRL 278
Table 274 KW Aparecki Scientific SRL: Business Overview 278
10.2.4 Nippon Oil Technology 279
10.2.5 Refrigeration Solutions Group 280 10.2.6 Stericox
India Private Limited 281
10.2.7 Thalheimer Kuhln 282
10.2.8 Antilia Scientific 282
*Business overview, product offerings, recent developments, and details of MnM view (key strengths/rights to win, strategic choices, weaknesses and competitive threats) for private companies , may not be captured
11 Appendix 283
11.1 Discussion Guide 283
11.2 Knowledge Store: Market & Markets Subscription Portal 288
11.3 Available Customizations 290
11.4 Related Reports 290
11.5 Author Details

このレポートの一部を購入することもできます。セクションごとの価格表をチェックしますか?

価格の内訳を今すぐ入手
business-development-success